Create and Explore
Data Frames of Visualizations

Trelliscope is an open source project that provides tools for data scientists to build and share interactive collections of visualizations for detailed data exploration and more.

About

What is Trelliscope?

Trelliscope is an R package (Python and JavaScript versions coming soon) that provides tools to interactively and flexibly visualize data in detail by producing many plots of subsets of your data — stored in a "data frame of visualizations" — and providing an interactive web application to explore them.

This is an effective visualization technique for getting into the details of your data, particularly when working with large datasets. The complexity and messiness of datasets require this rigor, as nuances are often missed because of neglecting to look at the data in detail, often leading to unreliable results.

Trelliscope is useful in these types of scenarios:

  • You want to visualize different parts of your data in detail and make comparisons across the parts (e.g. what does network activity look like each day for every computer in my organization?)
  • You have a large collection of images that you need to strategically scan through and possibly label
  • You have a very large and complex dataset that you do not understand and need to meticulously dive into it
  • You need to share these types of visualizations with collaborators to gain insights and drive the next steps of analysis

How does it work?

Start with a data frame

You can start with data in any form, but to use Trelliscope, you need to transform it into a data frame with one row per visualization and with columns representing metadata about each visualization. Trelliscope provides utilities for getting data into this form.

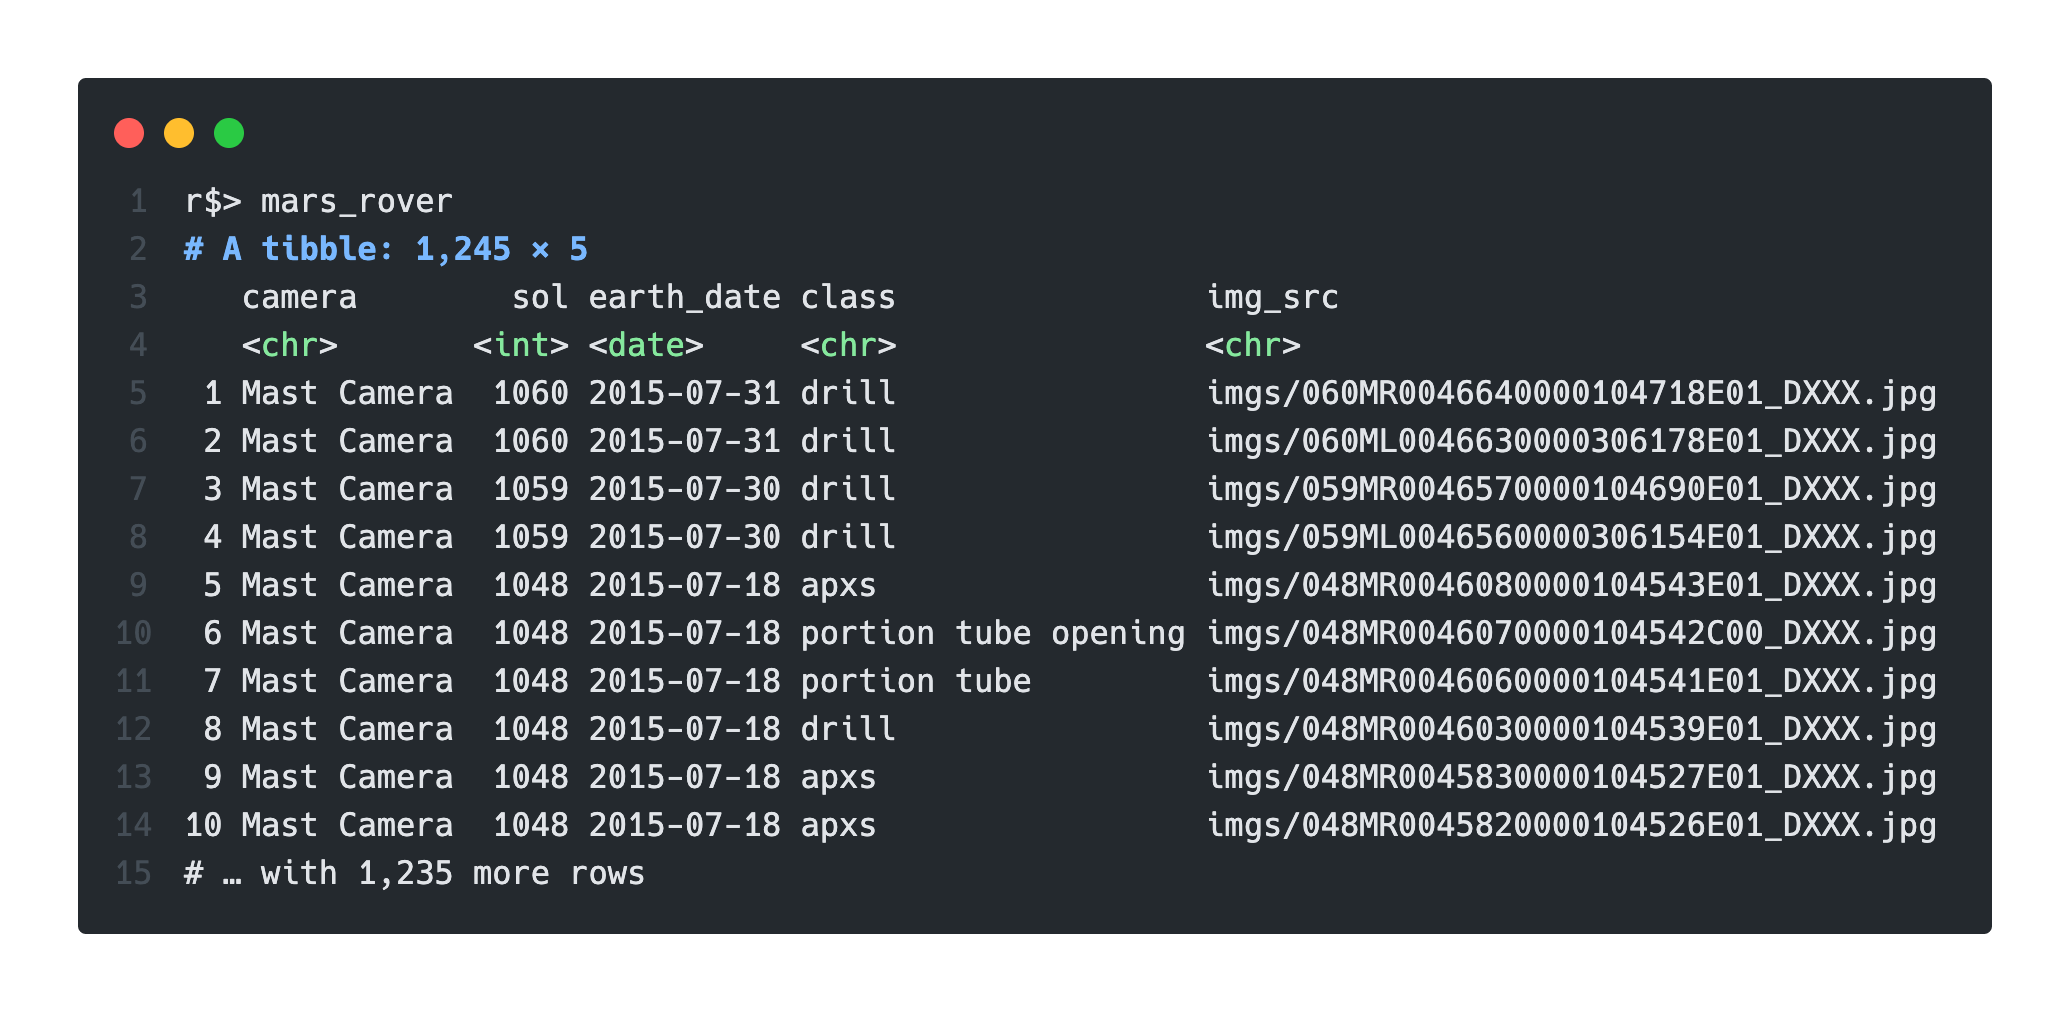
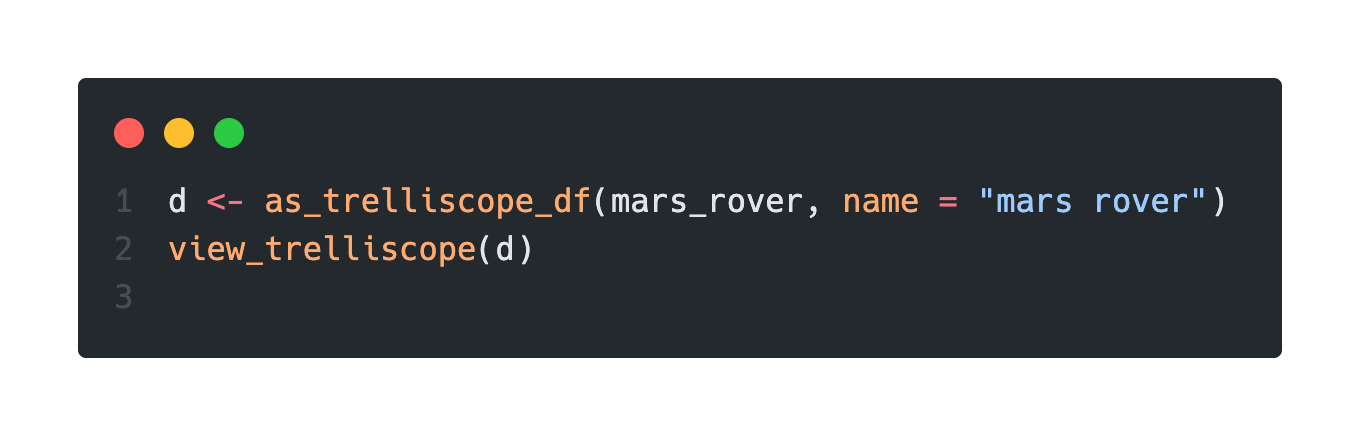
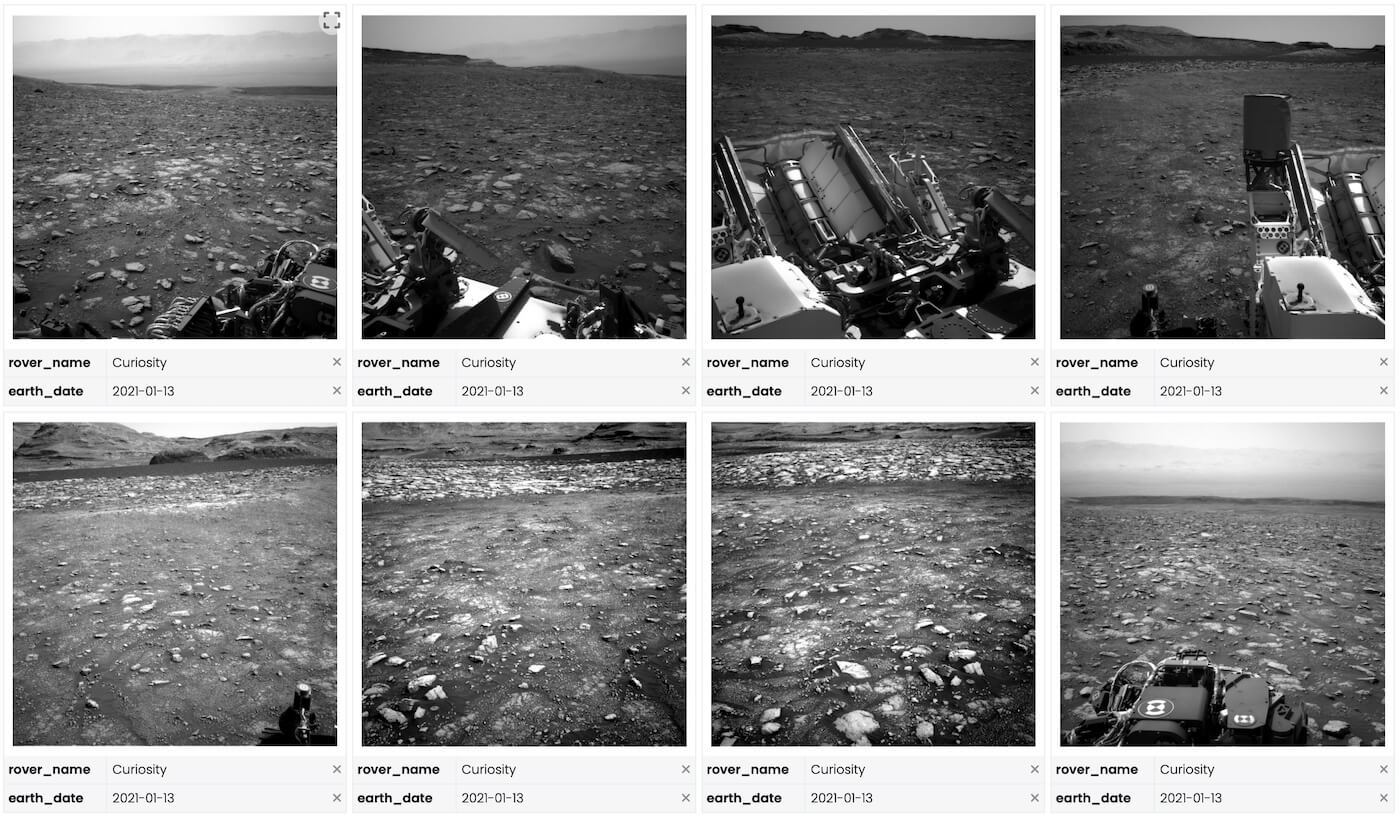
In the example below, we have a data frame that is already one row per image, and already has a column that points to the images. This contains images taken by the Mars rover Curiosity. We convert it into a "Trelliscope data frame". Note that the image column can also be a plot object.

Build a Trelliscope display

You can build a Trelliscope display with a few lines of code. There are several more options available to fine-tune the user experience: specifying pre-defined views (filters, sorting, labels, grid layout), user inputs, password protection, etc. See the documentation for more details.

View the output

Trelliscope produces a web-based interactive app that displays the visualizations in a grid that you can page through and investigate. The visualizations are filterable and sortable by the metadata provided in the Trelliscope data frame.

These visualizations can be easily and freely shared through services like GitHub pages or simply sending the app directory to a colleague.

Examples

Here are some examples of Trelliscope displays that you can explore. The associated code to create them is also provided.

Zillow Housing Data

Explore home prices and other relevant data over time for U.S. metro areas and counties

LEGO Sets and Minifigs

Explore every LEGO set and minifig cataloged by rebrickable.com

Baby Names

Explore the popularity and other attributes of baby names over time since 1880

Mars Rover Images

Explore over 1.1M images from the Mars rovers Curiosity, Opportunity, Perseverance, and Spirit

Life Expectancy

Explore the history of life expectancy over time for 142 countries

MRI Images

Explore MRI images from oasis-brains.org of patients with and without dementia

Stock Prices

Explore price history and other information for about 3,000 US stocks

Pokemon

Explore Pokemon by many of their characteristics as captured from Pokedex

NYC Taxi Data

Example of linking Trelliscope to a very large dataset of NYC taxi ride records

Get Started!

High-level interfaces for generating Trelliscope displays are being developed for R, Python, and JavaScript. Currently the R interface is the only one ready for use. Click the button to learn how to start using the R package to visualize your data.

Goals

The ideals below guide the development of this project.

Simple

We have designed Trelliscope to fit seamlessly into workflows familiar to data scientists, such as ggplot2 in R and other Tidyverse paradigms. You can get to a simple Trelliscope display quickly with minimal code.

Customizable

While it is easy to produce results very quickly with Trellisope, it provides many utilities for customizing the output for the best user experience, including the default view, specifying other predefined views, fine-tuning how the metadata is displayed, and even allowing for user inputs.

Scalable

Visualizing summary data is essential in exploratory analysis, but often important details can get lost in the summaries. The goal of Trelliscope is to make it fast and easy to explore data in detail, regardless of the size.

Shareable

The engine behind the Trelliscope viewer is written in JavaScript so there is no need for a special back-end setup to share Trelliscope displays. You can post on any web server or you can simply send the containing directory to your colleagues. We have also made it easy to embed Trelliscope displays in RMarkdown documents and Shiny apps.

Collaborative

The interactive displays you create with Trelliscope empower domain experts to explore data in detail, enabling them to answer questions in real time without writing code. In our experience it has served as an engaging and powerful communication and translation medium between data scientists and domain experts.

Open Source

Trelliscope is open source under the MIT license. Our code is your code.